available_themes() Available themes:
"white", "whitegrid", "whiteigrid,
"black", "blackgrid", "blackigrid",
"darkgray", "darkgraygrid", "darkgrayigrid",
"lightgraygrid", "mediumgraygrid"
Print available themes using available_themes():
available_themes() Available themes:
"white", "whitegrid", "whiteigrid,
"black", "blackgrid", "blackigrid",
"darkgray", "darkgraygrid", "darkgrayigrid",
"lightgraygrid", "mediumgraygrid"
set.seed <- 2025
x <- rnorm(200)
y <- x^3 + 12 + rnorm(200)draw_scatter(x, y, theme = theme_white(), fit = "gam")draw_scatter(x, y, theme = theme_whitegrid(), fit = "gam")draw_scatter(x, y, theme = theme_whiteigrid(), fit = "gam")draw_scatter(x, y, theme = theme_lightgraygrid(), fit = "gam")draw_scatter(x, y, theme = theme_mediumgraygrid(), fit = "gam")draw_scatter(x, y, theme = theme_darkgray(), fit = "gam")draw_scatter(x, y, theme = theme_darkgraygrid(), fit = "gam")draw_scatter(x, y, theme = theme_darkgrayigrid(), fit = "gam")draw_scatter(x, y, theme = theme_black(), fit = "gam")draw_scatter(x, y, theme = theme_blackgrid(), fit = "gam")draw_scatter(x, y, theme = theme_blackigrid(), fit = "gam")Each theme has a corresponding theme_* function that allows you to customize every aspect of the theme.
draw_scatter(
  x, y,
  theme = theme_whitegrid(
    grid_col = "blue", zerolines_col = "red", zerolines_lwd = 2.0)
)rtemis includes a number of builtin color palettes, along with a few functions to create, manipulate, and preview colors.
rtpalette() [1] "ucsfCol" "pennCol" "imperialCol"
[4] "stanfordCol" "ucdCol" "berkeleyCol"
[7] "ucscCol" "ucmercedCol" "ucsbCol"
[10] "uclaCol" "ucrColor" "uciCol"
[13] "ucsdCol" "ucCol" "scrippsCol"
[16] "caltechCol" "cmuCol" "princetonCol"
[19] "columbiaCol" "yaleCol" "brownCol"
[22] "cornellCol" "hmsCol" "dartmouthCol"
[25] "usfCol" "uwCol" "jhuCol"
[28] "nyuCol" "washuCol" "chicagoCol"
[31] "pennstateCol" "msuCol" "michiganCol"
[34] "iowaCol" "texasCol" "techCol"
[37] "jeffersonCol" "hawaiiCol" "nihCol"
[40] "torontoCol" "mcgillCol" "uclCol"
[43] "oxfordCol" "nhsCol" "ethCol"
[46] "rwthCol" "firefoxCol" "mozillaCol"
[49] "appleCol" "googleCol" "amazonCol"
[52] "microsoftCol" "pantoneBalancingAct" "pantoneWellspring"
[55] "pantoneAmusements" "grays" "rtCol1"
[58] "rtCol3" Let’s use previewcolor() to look at a selection of the available palettes:
previewcolor(rtpalette("imperialCol"), "Imperial")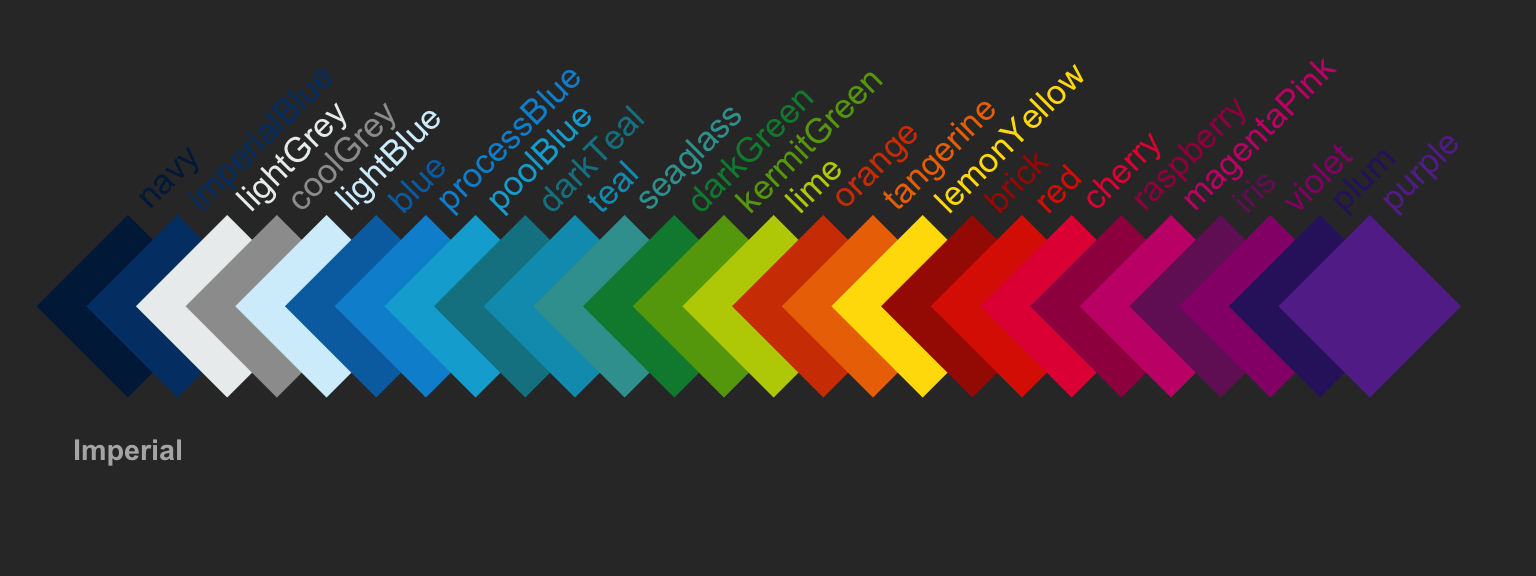
previewcolor(rtpalette("ucsfCol"), "UCSF")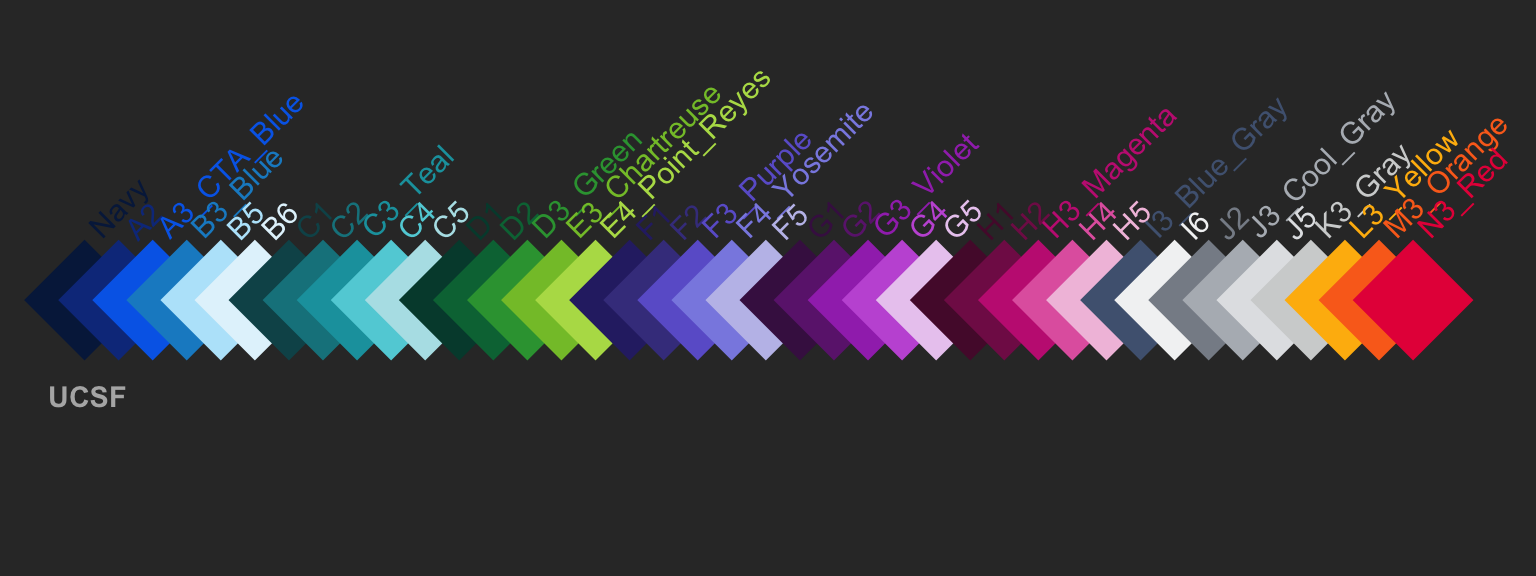
previewcolor(rtpalette("pennCol"), "Penn")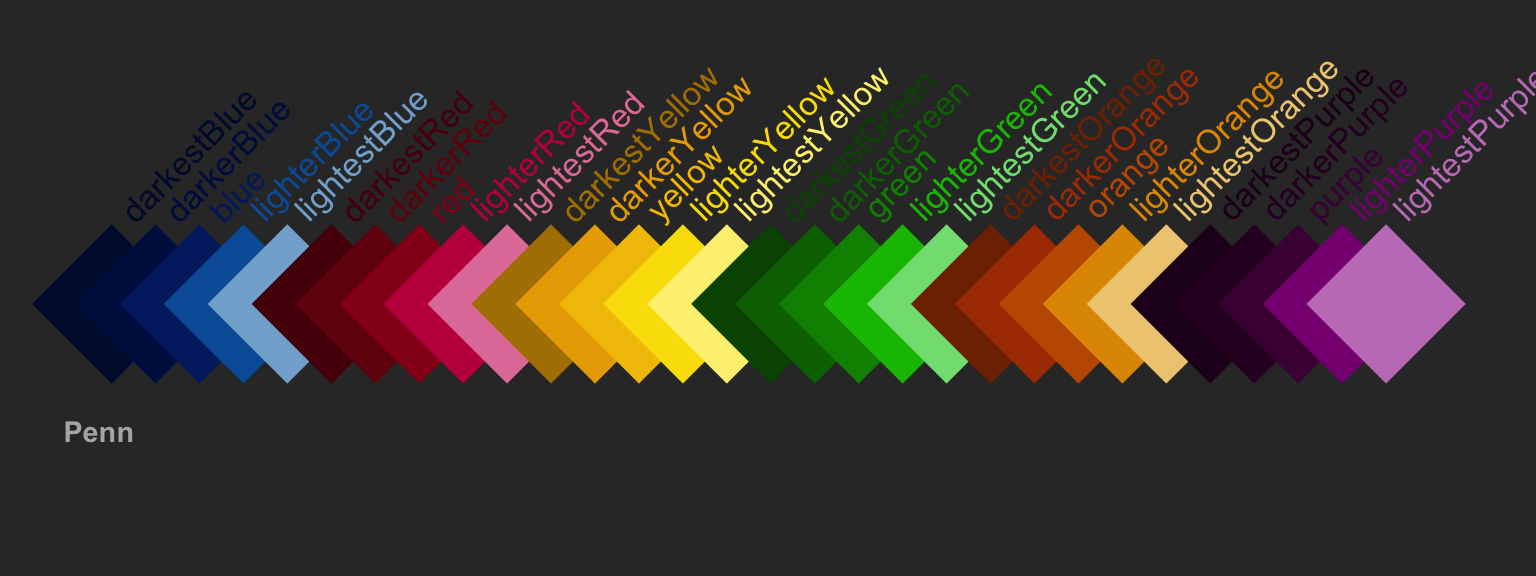
previewcolor(rtpalette("stanfordCol"), "Stanford")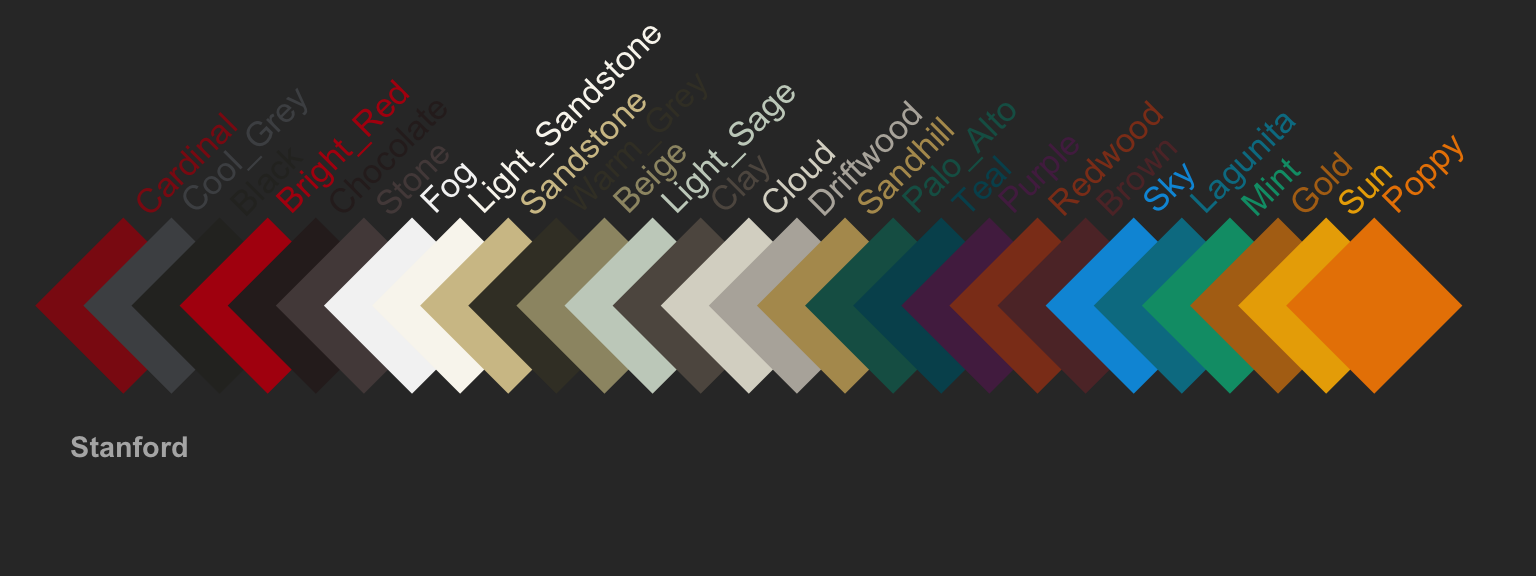
previewcolor(rtpalette("berkeleyCol"), "Berkeley")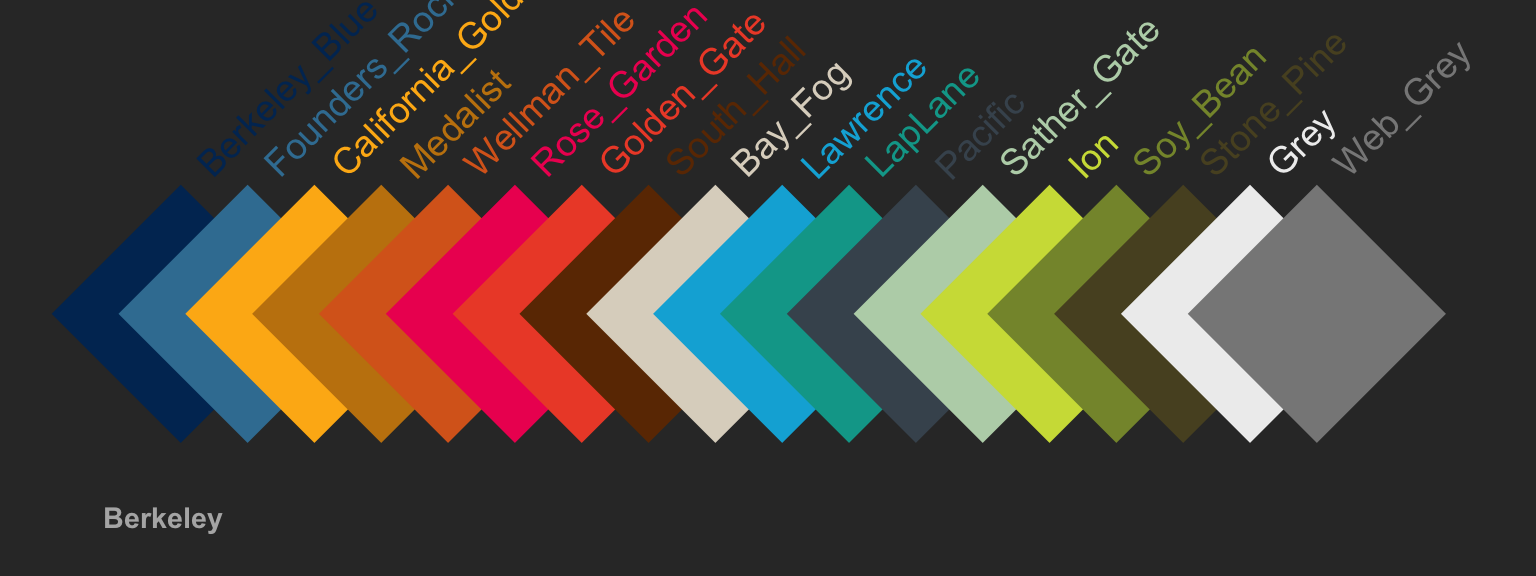
previewcolor(rtpalette("firefoxCol"), "Firefox")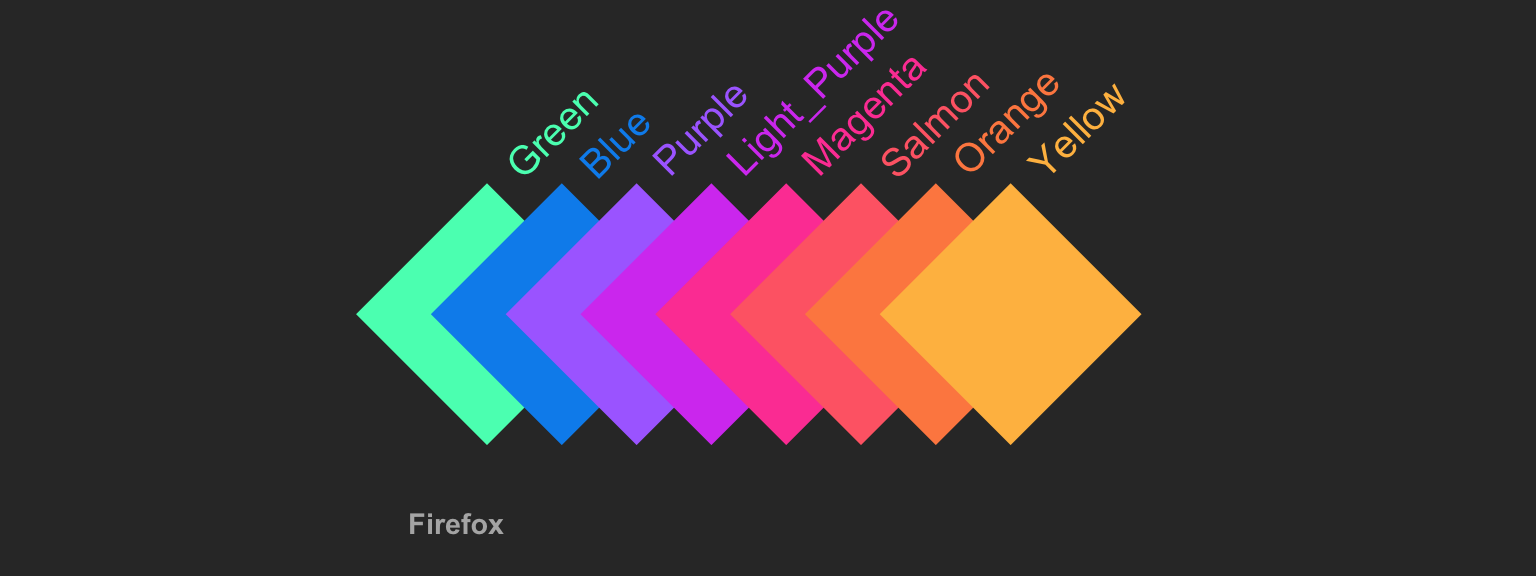
You can optionally set system defaults by running the following lines in R or adding them to your .Rprofile file, which is usually found in your home directory. For example, to default to the “darkgrayigrid” theme (works well with a dark VS Code or RStudio theme), you can use the following:
options(rtemis_theme = "darkgrayigrid")
options(rtemis_palette = "rtCol3")
options(rtemis_font = "Geist")
The first line sets the theme for all draw_* functions that support it, and the second line defines the default palette, which works with both light and dark themes.